Home›Concepts›Imbalances and Price Gaps›Liquidity Void
Concept 25 · Category B
ICT Liquidity Void Explained
What is Liquidity Void in ICT?
A relatively rapid price movement through a broad area with little two-way trading or limited candle overlap.
Definition of Liquidity Void
A visually thinly traded/inefficient price region, often represented by consecutive large directional candles.
How to identify Liquidity Void
Look for consecutive directional candles, shallow retracements and limited overlap; mark the entire impulsive leg rather than one tiny gap.
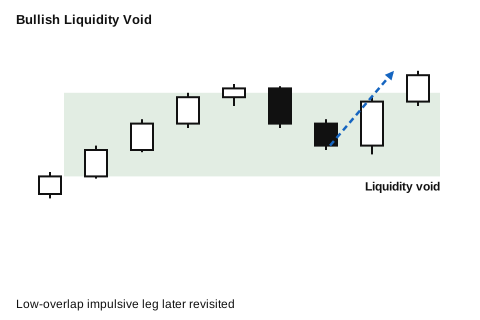
Bullish Liquidity Void example
a fast rally leaves a void below that price may later revisit before continuing.
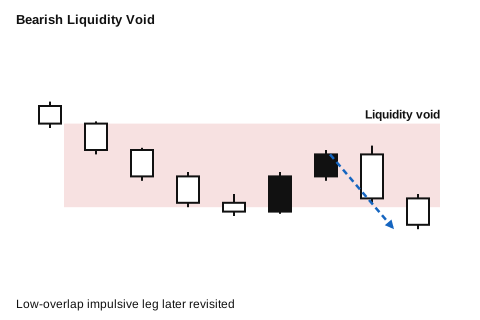
Bearish Liquidity Void example
a sharp decline leaves a void above that may be revisited.
Liquidity Void chart examples
Practical trading example
A news-free impulsive rally leaves a wide low-overlap region; a later pullback into it is monitored for rebalancing.
Common mistakes and important notes
Candles alone do not reveal actual traded volume at every price. A void may not fill completely.
Related ICT concepts
Part of Imbalances and Price Gaps. New to ICT? Start with the beginner guide.
ICT PD Arrays is an independent educational project and is not affiliated with or endorsed by Michael J. Huddleston. This page is not financial advice, and trading carries risk. Read the full disclaimer.