Home›Concepts›Liquidity Concepts›Draw on Liquidity
Concept 11 · Category A
ICT Draw on Liquidity (DOL) Explained
Draw on Liquidity · DOL
What is Draw on Liquidity in ICT?
The liquidity objective that price is expected to seek next, based on context, range and directional bias.
Definition of Draw on Liquidity
A projected target such as a prior high/low, equal highs/lows or another identifiable liquidity pool.
How to identify Draw on Liquidity
Map higher-timeframe structure, current range, nearby pools and session context; select the most relevant unfilled objective.
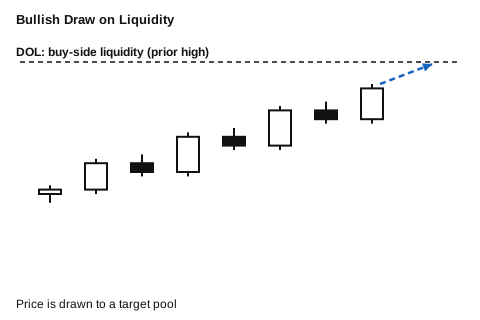
Bullish Draw on Liquidity example
the chosen DOL is BSL above a prior swing high.
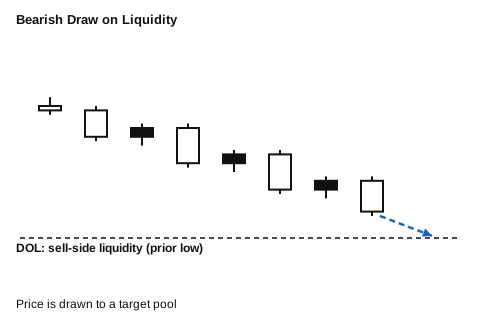
Bearish Draw on Liquidity example
the chosen DOL is SSL beneath a prior swing low.
Draw on Liquidity chart examples
Practical trading example
If daily bias is bullish and sell-side liquidity has been swept, identify the next clear daily/weekly high as a possible draw.
Common mistakes and important notes
DOL is a hypothesis, not a prediction guarantee. Reassess when structure or context changes.
Related ICT concepts
Part of Liquidity Concepts. New to ICT? Start with the beginner guide.
ICT PD Arrays is an independent educational project and is not affiliated with or endorsed by Michael J. Huddleston. This page is not financial advice, and trading carries risk. Read the full disclaimer.